Showing posts with label energy trends. Show all posts

Friday, 27 June 2014

DECC Energy Trends - some good news on renewables!

Just to make a change, the latest Energy Trends publication from DECC is not all bad news! The statistical press release actually starts with this graph, showing how renewable energy supply has grown rapidly in the UK recently:
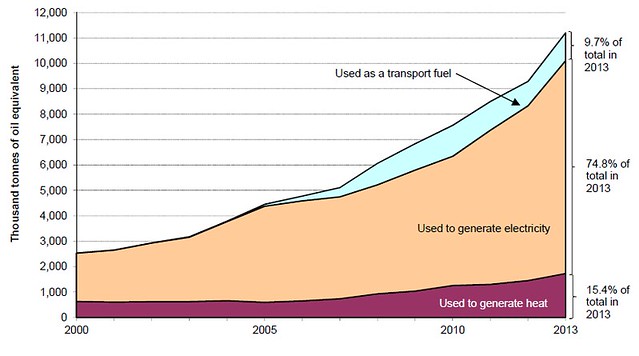
Energy Trends 2014 overall renewable energy

The biggest chunk of this is electricity, so here's how the overall electricity supply looked in the first quarter of 2014, compared to a year ago:
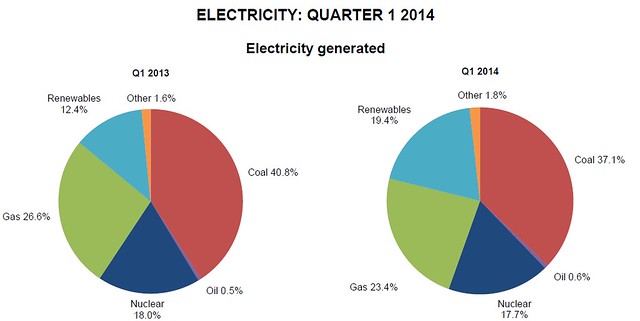
Energy Trends 2014 renewable electricity

What's interesting to note here is that while renewable energy supply did increase significantly in absolute terms, from 12.7 TWh a year ago to 18.1 TWh this year (43% increase), the reason its share in the chart above increased so dramatically is because the mild winter reduced demand for electricity by 10.4% compared to a year ago. What's really significant here to me is that the cut in demand was reflected in a big reduction in coal and gas burned to generate electricity - which is of course what is supposed to happen as renewable energy generation increases. But it underlines the fact that cutting demand has a huge impact on the proportion of energy we supply from renewable sources.

Although renewable energy capacity had increased over the past year, the other thing that boosted generation was the exceptionally wet and windy weather the UK experienced this winter. Probably not enough of a 'silver lining' to make it worth it for the people who got flooded though... The effect of the weather is shown clearly in the breakdown of renewable energy generation below, with wind and hydro well up on a year ago.
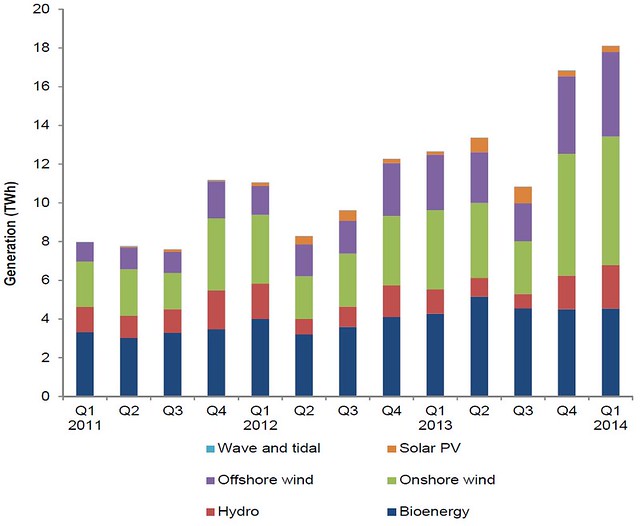
Energy Trends 2014 renewable electricity breakdown
The seasonal trend of more solar power in the summer and more wind/hydro in the winter is clearly shown above as well, which makes a good case for increasing the amount of installed solar PV to even out renewable supply across the year. Though having said that, demand is higher in the winter anyway, so maybe it's not too big a deal.

I'm afraid there's one not so good chart included for electricity though, and that's the one showing our net imports, which are steadily rising:
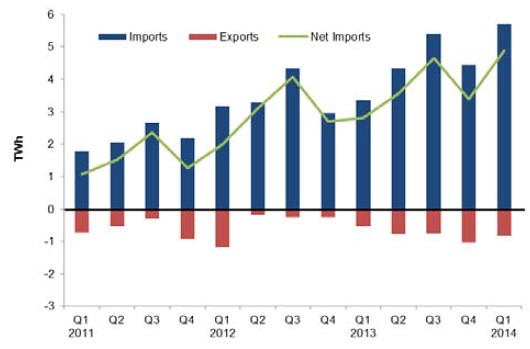
Energy Trends 2014 electricity net imports
Clearly this isn't a good thing for energy security, or for the UK balance of payments. Perhaps it's a sign of our steadily ageing generation infrastructure?

Moving on to fossil fuels, there's not a huge amount to report really:
  • Coal production was down 27.7% on a year ago.
  • Gas production was down 0.2%, but imports were down significantly due to the mild winter
  • Oil production was actually up 3.5% for a change!
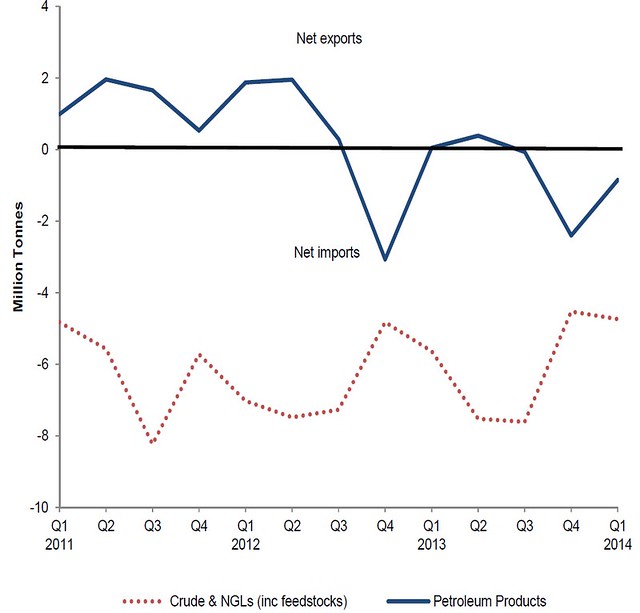
Of course, we are still a major energy importer - the graph below shows net imports for crude oil (red) and also for petroleum products (blue). We've been a net importer of crude oil for a long time, and the recent rise in production is too small to make a dent in that. But our change to being a net importer of products (diesel, petrol, etc.) is relatively new, and due to reductions in refinery capacity in the UK.

Energy Trends 2014 oil net imports 

So, nice to have some good news to report on the renewables front, even if the overall picture hasn't changed a great deal.

Click here to read the rest of this post.

Thursday, 26 September 2013

DECC: UK imported more than half its energy in Q2 2013

The latest DECC Energy Trends was published today, and it's no surprise that the decline in indigenous energy production has continued. The killer statistic is:

In the second quarter of 2013 net import dependency rose to 51.4 per cent, up 9.6 percentage points from the second quarter of 2012.
The chart on page 10 tells the story:
Uk energy import dependency
Here's the reasons, all comparing Q2 2013 to Q2 2012...

Coal: Production was down 24.3% on a year ago, and the proportion of our coal that came from imports rose from 81.7% to 93%. These imports came mostly from Russia (nearly half of the total!), USA and Columbia.

Oil: Production was down 13.4% on a year ago, and the proportion of our oil and oil products that came from imports rose from 40.5% to 45.1%. On a related note, the closure of the Coryton refinery resulted in a 5.6% drop in production of fuels from oil.

Gas: Production was down 2.8% on a year ago, and the proportion of our gas that came from imports rose from 43.6% to 52.5%. These imports came mostly from Norway, Qatar and the Netherlands.

Electricity: Production from nuclear power fell 16.5% due to several outages, but wind and PV generation rose by 58.6% (due to increased capacity), and hydro generation rose by 29% (due to higher rainfall). We imported 4.4% of our electricity.

Renewables
The key points here are:
  • Share of electricity supply up from 9.7% to 15.5%, due to increased capacity for wind and PV and increased rainfall to power hydro stations. There was also more generation from power stations converted to biomass, although co-firing with coal has reduced.
  • There's now 1,918 MW of capacity on a feed-in-tariff, 127 MW of which joined during Q2 2013.
  • Total renewable capacity in the UK was 19.5 GW, compared to 14.2 GW a year ago.

Large Combustion Plant Directive
There's a helpful table (page 72) that shows how many of the coal power stations that were running over winter 2012/13 won't be running this winter. It's for reasons like this that Ed Miliband's promise to freeze energy prices seems a bit foolhardy.
LCPD hours remaining

The status of the plants that opted out is given in another table:
LCPD plant staus

This shows that there's 5,050 MW of coal plant that ran last winter and won't be running this winter, and another 2,268 MW of oil plant that has shut - this didn't run much last winter, but when it did run it was urgently needed... On top of this there's another 1,730 MW of coal plant that is currently open but will close at some point during this winter. DECC also notes that:
From 1st January 2016 the remaining large combustion plants will be subject to more stringent emissions controls outlined in the Industrial Emissions Directive (IED). Plants that chose to opt-out of this directive will be limited to 17,500 hours between 2016 and 2023.
So there's more shutdowns to come!

Mike

Click here to read the rest of this post.

Wednesday, 21 August 2013

North Sea faces record fall in oil and gas production

Montrose Alpha

According to a story in The Telegraph today, this year could see a record fall in oil and gas production for the UK:
North Sea oil and gas production could decline by as much as 22pc this year - the biggest annual slump on record – as maintenance on ageing infrastructure hits operations, the industry body has warned. Oil & Gas UK said it now expected average output to fall to between 1.2m and 1.4m barrels of oil and gas per day (boepd) this year, down from 1.54m boepd in 2012.
Full story
The decline has been in the region of 10% a year for some time now anyway, but some major technical issues in the past year have pushed production down faster than has been typical. In some ways this isn't all bad - it means that oil and gas is still there to use later on, when prices are higher. But there's always the risk that it's not worth repairing failing machinery if there's not much left to be extracted from a particular field, leaving it locked underground for good. (Of course, from a climate change point of view that's a good thing!)

This trend doesn't fully show up in the latest DECC Energy Trends, as it only covered up to Q1 2013, but even then oil production was down 15% from a year ago, and gas down 14.5%. It'll be interesting to see what's in the September edition...

On a slightly more positive note, it seems that more attention is being paid to thorium as a nuclear fuel. Obviously nuclear energy of any sort has numerous downsides, but thorium does seem to be be 'less bad' than uranium in several ways, so it'll be interesting to watch for more developments...

Click here to read the rest of this post.

Saturday, 30 March 2013

UK Energy Trends: the decline continues

A couple of days ago the latest UK government Energy Trends publication was released by DECC. As is now normal, it does not make cheery reading...

Production

Here's the headline figures for 2012 UK energy, compared to 2011:
  • Total energy production down 10.5%
  • Oil production down 14.5%
  • Gas production down 14%
  • Coal production down 10%
  • Hydro, wind and solar generation up 21%
So, bad news on fossil fuel production, but at least renewables are growing. But note that even after this growth, renewables only supplied 11% of electricity in 2012, and a much smaller percentage of total energy, so there's still some work to do there!

There are also figures focused on the fourth quarter of 2012, comparing it to Q4 2011. The results there are even worse than for the year as a whole:
  • Total energy production down 14%
  • Oil production down 20%
  • Gas production down 21%
  • Coal production down 10%
  • Hydro, wind and solar generation up 7.5%
Gas production was much lower due in part to the leak at the Elgin platform, which is now gradually coming back into production, so hopefully the decline through 2013 won't be quite so severe. However, gas demand will be increasing, due to the closure of coal-fired power stations.

Imports

Here's the figures for how much we were importing, given for 2012 as a whole and then for Q4 2012:
  • 43% of all energy was imported through 2012, rising to 48.7% in Q4
  • About 39% of oil demand was met by imports, falling to 36% in Q4 as refinery demand reduced after the closure of Coryton refinery
  • About 47% of gas demand was met by imports, rising to 55% in Q4
  • About 70% of coal demand was met by imports, falling to 64% in Q4
Of course, the declines in oil and gas production are not just down to depletion, there have also been various technical problems and accidents, as well as maintenance. But these events are not one-offs, they happen every year as our energy infrastructure ages...

We're also a net importer of petroleum products, such as petrol, diesel and jet fuel, after the Coryton refinery shut last year - so the reduction in oil import dependency was offset by an increase in dependency on imports of the finished products.

Electricity

Looking at electricity in more detail, a few key points are worth noting:
  • Coal's share of electricity generation increased from 29.5% in 2011 to 39.3% in 2012, while gas went in the opposite direction, from 39.9% to 27.5%. This was due to price variations and upcoming carbon taxes for burning coal, combined with the remaining hours left to run on coal plants opting out of compliance with the LCPD. As many of these plants are closing during 2012 (some have already closed), the balance may be expected to swing from coal back to gas again in 2013.
  • Net imports of electricity doubled from 2011 to 2012, and represented 3.4% of total supply.
  • Installation of renewable energy capacity is still going ahead quickly, and new record generation was recorded, but it is still a relatively small proportion of overall energy.

Summary

Well, what can I say? We're producing less, importing more, but only using a little bit less energy. With the various ongoing gas supply problems I've been reporting on this blog, it is imperative that the whole of the UK takes action to reduce energy use, particularly for heating and electricity, before we get to winter 2013/14. The alternative is that we pay more. A lot more.

Oil rig: Erik Christensen


Click here to read the rest of this post.

Thursday, 27 September 2012

UK energy decline continues - DECC Energy Trends Sep 2012

DECC has just published their latest quarterly Energy Trends, and surprise surprise, the UK's energy production is continuing to plummet. The headline figure is that total indigenous energy production has fallen by 10.1%, but this includes nuclear power, which isn't really indigenous as we have to buy uranium for reactors from other countries. So excluding nuclear, the drop is actually 11.4% compared to a year ago.

Here's the breakdown of the overall changes in production from Q2 2011 to Q2 2012:

  • Coal: down 2.9%
  • Oil: down 12.2%
  • Gas: down 12.9%
  • Nuclear: down 3.3%
  • Renewables: up 6.5%

While it's pleasing to see renewables up 6.5%, we should bear in mind the relative quantities of energy we're talking about... So here's the amounts produced in Q2 2012 in Mtoe (million tonnes of oil equivalent):

  • Coal: 3.8 Mtoe
  • Oil: 12.9 Mtoe
  • Gas: 10.2 Mtoe
  • Nuclear: 4.2 Mtoe
  • Renewables: 0.43 Mtoe
Still a very long way to go to get off fossil fuels then...

The Energy Trends table 1.3a (page 11) conveniently tells us the total energy import dependency of the UK as well. Here's the results for Q2 over the past 3 years:
  • Q2 2010: 26.0% imports
  • Q2 2011: 31.8% imports
  • Q2 2012: 42.1% imports
Anyone else spot a trend here? 42.1% is a new record level of dependency on imports, and if the trends keep going the same way as in previous years, we'll set some new record imports in the next two quarters as well.

Here's a few graphs from the report for the key energy sources:

 Oil import/export/production

Gas import/export/production

Coal imports/production
 

Fuel used to generate electricity
 Renewable sources of energy

So, with ever lower energy production, and the changes to gas storage I mentioned in my previous post, we may be in for interesting times if this winter is a cold one...

Mike

Click here to read the rest of this post.

Friday, 29 June 2012

Decline in UK energy production continues: DECC

DECC published the latest instalment of its quarterly Energy Trends yesterday, here's a quick summary of the key figures:

Oil

  • Production down 13% on a year ago.
  • Imports increased by 21.7% on a year ago.
  • Crude oil stocks have been declining gradually over the past few years.
  • About 34% of UK oil demand was met by imports over the past 12 months.

Gas

  • Gas production was down 14% on a year ago.
  • Imports shifted away from LNG and towards pipelines compared to a year ago - this isn't surprising given that Japan has been importing extra LNG due to the shutdown of its nuclear reactors since Fukushima.
  • Net imports were down 13% on a year ago, due to milder weather and a significant fall in the use of gas for electricity generation (coal use increased in its place).
  • Despite the fall in net imports, the UK still imported 42% of its gas over the past 12 months.

Coal

  • Coal production was down 12% on a year ago.
  • Coal imports were up 20.8% on a year ago. This was still lower than Q1 2009, but it's worth noting that stocks of coal are much lower now than then, so it seems the imports would have been higher still if not for this.
  • Over the past 12 months, about 66% of our coal has been imported.

Nuclear

  •  Generation fell 11.6% compared to a year ago.

Renewables

  • Generation was up 39% compared to a year ago, though down a bit on the record set in Q4 2011. High rainfall and stronger wind have helped here, as well as increased capacity.
  • Renewable share of total electricity was 11.1%, compared to 7.7% a year ago.
  • Installed capacity was up 36% on a year ago, to 13GW.

Page 72 also had a really interesting graph, showing industrial energy and fuel prices:
Note the steady run up in prices to the peak in 2008, followed by a dip as recession took hold. However, you can see that since that dip, prices have reached new highs (in £ sterling) for crude oil, fuel oil and coal, while in 2011 electricity and gas are pretty much back where they were in 2008.

I think this is why the economic problems are not going to go away - the high and rising prices make it progressively more difficult for the economy to grow, even without the growing pile of debt and austerity measures to deal with it.
    You can download a copy of DECC's latest Energy Trends here.

    Mike

    Click here to read the rest of this post.

    Friday, 30 March 2012

    2011: A bad year for UK energy production

    DECC has just released it's latest Energy Trends publication, including statistics for 2011 as a whole, as well as for the fourth quarter of that year. It's not looking good....

    Here's some lines form their summary page, and comments from me:

    Total energy production was a record 13½ per cent lower than in 2010.
    Note the word 'record' in there - and that's from DECC, not from me. It's a bit alarming that over a decade after the UK's peak in oil and gas production, that we're hitting new record percentage declines in energy output. Of course, there are other factors as well as the stuff simply running out, but we have to assume they'll come along every year anyway - like the leak at the Elgin platform right now.

    Oil production was 17½ per cent lower than in 2010, the lowest level of production since the 1970s and part of a long downward trend.
    Another shockingly steep decline in output...

    Natural gas production was 21 per cent lower than in 2010. In 2011 gross imports of natural gas were greater than gross production for the first time since 1967, with Liquefied Natural Gas (LNG) accounting for 47 per cent of gas imports.
    Just to underline this, as they don't spell it out very clearly. In 2011 the UK imported more gas than it produced. Half of these imports were LNG, which is traded globally and can easily be diverted to where the price is higher.

    Coal production was ½ per cent lower than in 2010. Coal imports were 23 per cent higher.
    Nothing new here, continuing the trend of growing imports.

    Total primary energy consumption for energy uses fell by 7½ per cent from 2010. When adjusted to take account of weather differences between 2010 and 2011, primary consumption fell by 2 per cent.
    We all remember how cold it was in both early and late 2010, so it's not surprising to see a fall in energy consumption in 2011. But after allowing for that, consumption still fell 2%, probably because the economy is still struggling here, and less money means spending less on stuff, including energy.

    Low carbon electricity’s share of generation increased from 23 per cent in 2010 to 28½ per cent in 2011, due to higher renewables and nuclear generation. Renewables’ share of generation increased by 2½ percentage points on 2010 to a record 9½ per cent.
    The one positive bit I could find in there... It's good to see renewable electricity climbing quickly here, though it's important to note that this includes landfill gas and co-firing with coal. Most of the increase came from wind and hydro though, as it was wetter and windier in 2011 than 2010.

    I wonder what 2012 will bring? We already have the Elgin gas leak and RWE and E.On pulling out of new nuclear plants....

    Mike

    Click here to read the rest of this post.

    Friday, 1 July 2011

    Huge decline in UK oil and gas production in Q1 2011

    The latest instalment of DECC's Energy Trends series has just been published, covering Q1 2011. You can download a copy here (1.8MB PDF).

    The summary page says it all really, with these bullet points:

    • Total energy production was 11 per cent lower than in the first quarter of 2010.
    • Oil production was 15½ per cent lower than in the first quarter of 2010, due to maintenance activity and slowdowns.
    • Natural gas production was 17½ per cent lower compared with the first quarter of 2010. Net imports of gas increased by ½ per cent. Liquefied Natural Gas (LNG) accounted for 43½ per cent of gas imports.
    If, like me, you prefer to see it represented graphically, you'll be pleased with what I've prepared for you below...

    Here's a chart of quarterly oil production in the UK, from the start of 1999 to Q1 2011:
    UK oil production 1999-2011

    Not looking too promising, is it? To help see the trend, here's a graph showing the % change year-on-year from 2000 to 2011:
    UK oil production change 1999-2011

    As you can see, there's been the odd blip where production has risen, but the last time was in 2007, and the first quarter for this year set a new record for the decline.

    Moving on to gas, here's the another production graph, but this time I've added on the amount being imported as well:

    As you can see, there's a similar trend as for oil, though with greater seasonal fluctuations. I think this is probably because the gas market is more fluid, with pipelines connecting us to Europe, meaning production is often slowed down while prices are low. Here's a percentage change graph again, with the same high fluctuations, and close to a new record on decline:
    UK gas production change 1999-2011

    Just to reiterate the problem we have with gas, here's another graph showing the percentage of UK gas supplied by imports, on a quarterly basis:
    share of UK gas imported 1999-2011

    As you can see, we imported more than half our gas in the final quarter of 2010, which isn't surprising as it was very cold, but also in the first quarter of 2011 - when it was actually relatively mild!

    Many thanks to DECC for providing these figures publicly - shame the government isn't taking the urgent action which the graphs above should prompt them to. It's not just about energy security and keeping the lights on this winter, it's also about whether we can afford the imports. To put it in context, wholesale gas has been trading on the National Grid at about 2p/kWh this summer. The graphs above are in GWh, one of which would cost £20,000 at the same rates.

    In the past two quarters we've imported over 367,000 GWh - that's about £7.3 billion worth of gas. So if anyone was still wondering why gas prices are going up,  now you have part of the answer...

    It's summer now, but winter is coming - take the time over the coming months to insulate your walls and loft if you've not already done so, and if you want to do even more, take a look at my other blog for some ideas.

    Click here to read the rest of this post.