Friday, 27 June 2014

DECC Energy Trends - some good news on renewables!

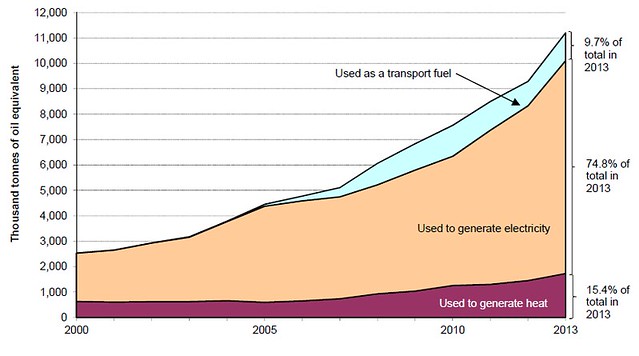
Just to make a change, the latest Energy Trends publication from DECC is not all bad news! The statistical press release actually starts with this graph, showing how renewable energy supply has grown rapidly in the UK recently:
Energy Trends 2014 overall renewable energy

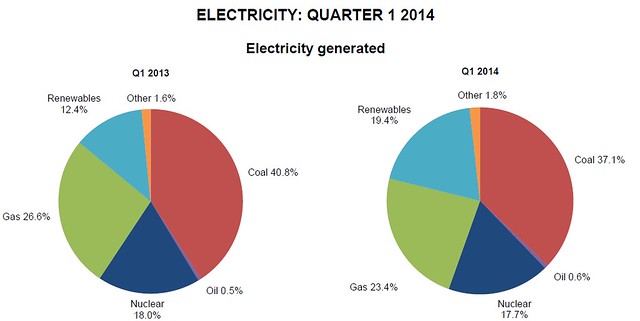
The biggest chunk of this is electricity, so here's how the overall electricity supply looked in the first quarter of 2014, compared to a year ago:
Energy Trends 2014 renewable electricity

What's interesting to note here is that while renewable energy supply did increase significantly in absolute terms, from 12.7 TWh a year ago to 18.1 TWh this year (43% increase), the reason its share in the chart above increased so dramatically is because the mild winter reduced demand for electricity by 10.4% compared to a year ago. What's really significant here to me is that the cut in demand was reflected in a big reduction in coal and gas burned to generate electricity - which is of course what is supposed to happen as renewable energy generation increases. But it underlines the fact that cutting demand has a huge impact on the proportion of energy we supply from renewable sources.

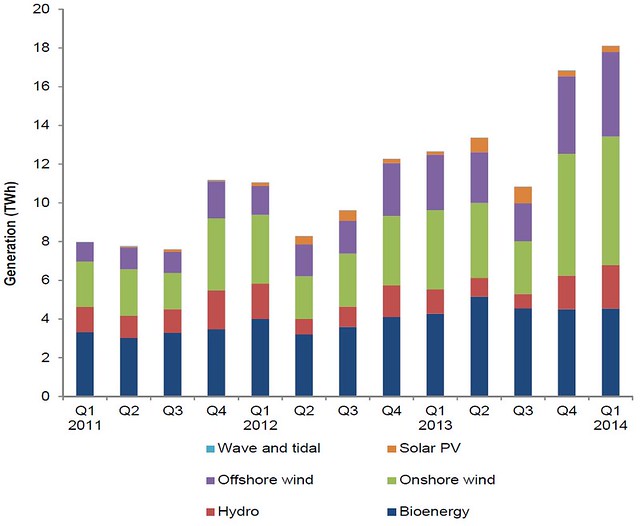
Although renewable energy capacity had increased over the past year, the other thing that boosted generation was the exceptionally wet and windy weather the UK experienced this winter. Probably not enough of a 'silver lining' to make it worth it for the people who got flooded though... The effect of the weather is shown clearly in the breakdown of renewable energy generation below, with wind and hydro well up on a year ago.
Energy Trends 2014 renewable electricity breakdown
The seasonal trend of more solar power in the summer and more wind/hydro in the winter is clearly shown above as well, which makes a good case for increasing the amount of installed solar PV to even out renewable supply across the year. Though having said that, demand is higher in the winter anyway, so maybe it's not too big a deal.

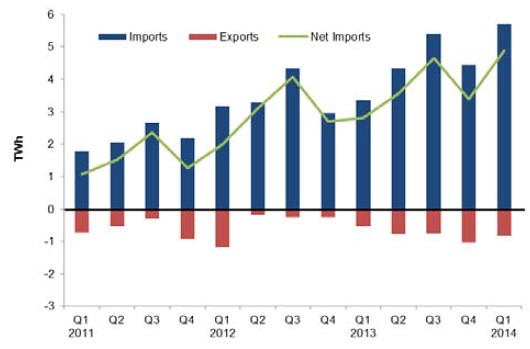
I'm afraid there's one not so good chart included for electricity though, and that's the one showing our net imports, which are steadily rising:
Energy Trends 2014 electricity net imports
Clearly this isn't a good thing for energy security, or for the UK balance of payments. Perhaps it's a sign of our steadily ageing generation infrastructure?

Moving on to fossil fuels, there's not a huge amount to report really:
  • Coal production was down 27.7% on a year ago.
  • Gas production was down 0.2%, but imports were down significantly due to the mild winter
  • Oil production was actually up 3.5% for a change!
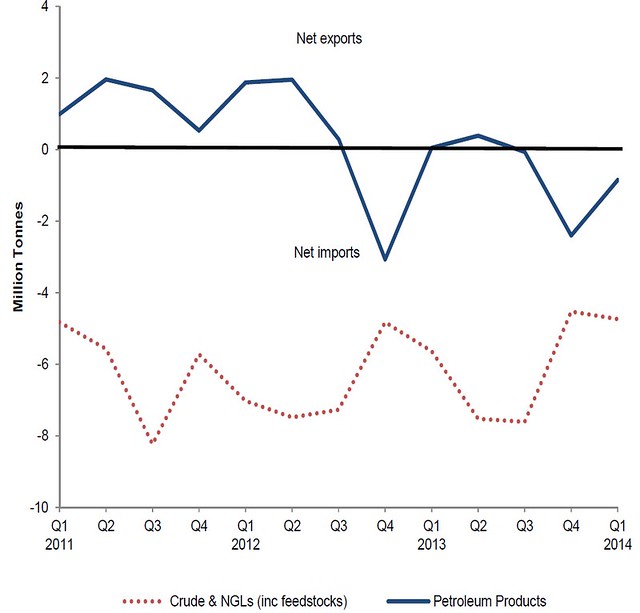
Of course, we are still a major energy importer - the graph below shows net imports for crude oil (red) and also for petroleum products (blue). We've been a net importer of crude oil for a long time, and the recent rise in production is too small to make a dent in that. But our change to being a net importer of products (diesel, petrol, etc.) is relatively new, and due to reductions in refinery capacity in the UK.

Energy Trends 2014 oil net imports 

So, nice to have some good news to report on the renewables front, even if the overall picture hasn't changed a great deal.

Click here to read the rest of this post.

Saturday, 14 June 2014

Catcher - 'major' new North Sea Oil field in context

Numerous news sources are busy celebrating the planned development of the new Catcher oil field in the North Sea. But few of them put it in context, with even the BBC describing it as "a major North Sea field", saying it could ultimately produce 100 million barrels of oil, and other sources mention a peak production of 50,000 barrels per day. These sound like big numbers, but let's compare to the real major oil field of the North Sea - Forties.

PlatformHolly.jpg

Forties is expected to produce over 4 billion barrels during its operational lifetime, and reached a peak output of  520,000 barrels per day in 1978. So that's forty times bigger than the Catcher field, and ten times the peak output. Catcher doesn't look so big now, does it?

Let's also compare it to our current oil production: 925,000 barrels per day, and our oil consumption of 1.5 million barrels per day. So it's basically going to produce 3.3% of our national consumption. Great, that'll make a huge difference... not.

Peak oil is still alive and well, and the IEA's recent report showed that over 80% of investment in energy oil and gas is just to make up for declining production from existing fields. So don't expect to see cheaper petrol or diesel any time soon. Or ever, in fact.


Image: "PlatformHolly" by employee of the U.S. government: public domain - http://www.netl.doe.gov/technologies/oil-gas/Petroleum/projects/EP/ResChar/15127Venoco.htm -- U.S. Department of Energy. Licensed under Public domain via Wikimedia Commons.

Click here to read the rest of this post.

Friday, 10 January 2014

Former BP geologist: peak oil is here and it will 'break economies'

If you thought peak oil had gone away, or at least turned out to be not as bad as you thought it might, perhaps it is time to think again. I expect this story was missed by many, being published as it was the day before Christmas Eve, indeed I only just became aware of it myself. I suggest you go and read the full article in The Guardian, but to show you why, here's a few quotes from the article, which itself is quoting Dr Richard Miller, who worked as a geologist for BP from 1985 to his retirement in 2008.


Dr. Miller critiqued the official industry line that global reserves will last 53 years at current rates of consumption, pointing out that "peaking is the result of declining production rates, not declining reserves." Despite new discoveries and increasing reliance on unconventional oil and gas, 37 countries are already post-peak, and global oil production is declining at about 4.1% per year, or 3.5 million barrels a day (b/d) per year: "We need new production equal to a new Saudi Arabia every 3 to 4 years to maintain and grow supply... New discoveries have not matched consumption since 1986. We are drawing down on our reserves, even though reserves are apparently climbing every year. Reserves are growing due to better technology in old fields, raising the amount we can recover – but production is still falling at 4.1% p.a. [per annum]."
...
"... a sustained decline in global conventional production appears probable before 2030 and there is significant risk of this beginning before 2020... on current evidence the inclusion of tight oil [shale oil] resources appears unlikely to significantly affect this conclusion, partly because the resource base appears relatively modest."

In fact, increasing dependence on shale could worsen decline rates in the long run: "Greater reliance upon tight oil resources produced using hydraulic fracturing will exacerbate any rising trend in global average decline rates, since these wells have no plateau and decline extremely fast - for example, by 90% or more in the first 5 years."
...
"The final peak is going to be decided by the price - how much can we afford to pay?", Dr. Miller told me in an interview about his work. "If we can afford to pay $150 per barrel, we could certainly produce more given a few years of lead time for new developments, but it would break economies again."

And the 'least worst' it gets is:
"We are probably in peak oil today, or at least in the foot-hills. Production could rise a little for a few years yet, but not sufficiently to bring the price down; alternatively, continuous recession in much of the world may keep demand essentially flat for years at the $110/bbl price we have today. But we can't grow the supply at average past rates of about 1.5% per year at today's prices."

Like I said, go and read the full article...

The Royal Society journal it all comes from  is available free online too - I'll read through it when I have time and post some comments, but if you want to take a look now, it's here.

IPC oil derrick

Click here to read the rest of this post.

Saturday, 21 December 2013

DECC Energy Trends - UK energy decline continues

The latest Energy Trends have been published by DECC, so here's a summary... (all graphs are copied from the publication)

Unsurprisingly, the upward trend in net UK energy imports continues:

UK Net Energy Import Dependency Q3 2013

At least fossil dependency is coming down, though this includes nuclear:

UK Fossil Fuel Dependency Q3 2013

Coal

Coal mines have been closing - production is down 32% over last year. Imports are up 12%, and mainly come from Russia, Columbia and the USA. Total consumption is actually down 2.8% on a year ago, due to a reduction in the use of coal for generating electricity - coal use in other areas increased significantly.

UK Coal supply Q3 2013

Oil and petroleum products

The downward trend of oil and NGL production has continued, with a new post-peak low being hit in Q3 - down 7% on a year ago:

UK Oil production and trade Q3 2013

The following graph shows net trade in both crude oil and petroleum products. Unsurprisingly, the UK is importing a lot of crude oil, but our traditional position as an exporter of petroleum products is also being eroded as refineries are closed down:

UK Oil and product trade Q3 2013

Gas

Gas production actually declined less than in recent times, with a drop of 3.8% compared to a year ago. However, this is due to the return to production of the Elgin field, which shut down due to a leak in March 2012, rather than any pause in the overall decline. Demand for gas was down 8.2% on a year ago, due to warmer temperatures and less gas being burned to generate electricity.

UK Gas production and trade Q3 2013

Electricity

Electricity demand was down 0.6% compared to a year ago, although this combines a rise in industrial use and a fall in domestic use. Interestingly, domestic use was the lowest for Q3 for fourteen years! Electricity generated from renewable sources increased from 11.7% in Q3 a year ago to to 13.2% this year, although this is lower than the 15.4% reached in Q2 2013. Lower wind speeds resulted in reduced generation despite increased capacity, but this was compensated for by conversion of coal fire power stations to burn biomass instead. This is controversial though, as the biomass used is imported rather than being sourced from within the UK.

Generation from solar PV was up 31.9%, due to increased capacity, but hydro was down 26.6% due to low rainfall. In terms of installed capacity:
  • onshore wind was up 25% at 7,120MW
  • offshore wind was up 36.3% at 3,657MW
  • solar PV was up 57% at 2,542MW
  • anaerobic digestion was up 33.5% at 122MW

UK Renewable Electricity Generation Q3 2013

So, nothing shocking this quarter - a continued decline in fossil fuel production, a steady but slow rise in renewable energy, and a few new highs and lows set compared to recent years.

Mike

Click here to read the rest of this post.

Friday, 29 November 2013

IEA World Energy Outlook 2013 video presentation

The 2013 IEA World Energy Outlook is now out, but as it's pretty expensive, and long, you might like to watch the videos of the key facts being presented by some of the key people, that the IEA has kindly uploaded to YouTube. There's three - intro, main presentation, and Q&A:


Mike

Click here to read the rest of this post.

Thursday, 28 November 2013

Blown fuse in Norway reduces UK gas supply

OK, well not a blown fuse literally, but a circuit breaker tripped and shut down a chunk of output from the Ormen Lange gas field, which is one of the main sources of gas for the UK, via the Langeled pipeline. This story indicates the cut should only be for 24 hours. You can see the effect on this graph of Langeled output taken from a National Grid website:

Langeled shortfall 28Nov2013
Not a huge problem today, but this is exactly the kind of thing that can cause dangerously low supplies when it happens in colder weather - of which there is more to come in the next few months...

Mike

Click here to read the rest of this post.

Tuesday, 12 November 2013

Gas Bills 'Could Rise' Due To Low Reserves

Good to see that some people are aware of the issues the UK has with gas supply - Sky News in this case!

Gas prices could soar this winter if the national supply runs short during another cold snap, an energy expert has warned. Industry analyst Peter Hughes told Sky News that a "perfect storm" last March of extreme weather and the shutdown of two major pipelines caused prices to double. And that could happen again because the Government has refused to support the storage of more gas. "It foreshadows things to come," he said.

"The situation in terms of the risks will only get worse as North Sea production runs down and demand rises. That's the double whammy. And if you don't have more storage that translates into real vulnerability."

Britain currently stores enough gas for 13 days of supply. But Germany has reserves to last 69 days, in case there is a problem with the supply from countries such as Russia.

Even the gas storage that we DO have is not always working properly... News out today from Reuters says that withdrawals from Centrica's Rough storage site, the largest in the UK, will be limited for a few hours today and for four days from 21 Nov. More importantly perhaps, no gas can be injected back into for two weeks starting on 18 Nov. Presumably this is all down to maintenance work, but that really should have been completed earlier in the year... Let's hope we get a mild winter!

Easington Langeled Terminal

Click here to read the rest of this post.