Friday 27 June 2014

DECC Energy Trends - some good news on renewables!

Just to make a change, the latest Energy Trends publication from DECC is not all bad news! The statistical press release actually starts with this graph, showing how renewable energy supply has grown rapidly in the UK recently:

Energy Trends 2014 overall renewable energy

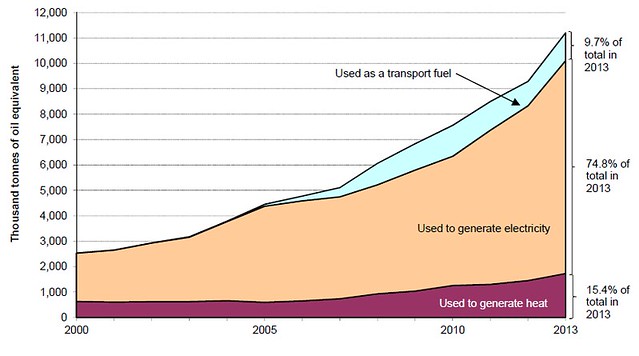
The biggest chunk of this is electricity, so here's how the overall electricity supply looked in the first quarter of 2014, compared to a year ago:

Energy Trends 2014 renewable electricity

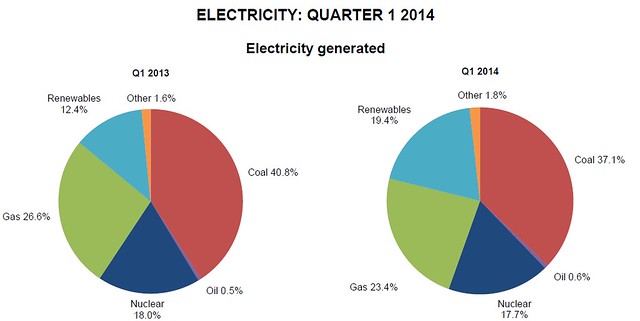
What's interesting to note here is that while renewable energy supply did increase significantly in absolute terms, from 12.7 TWh a year ago to 18.1 TWh this year (43% increase), the reason its share in the chart above increased so dramatically is because the mild winter reduced demand for electricity by 10.4% compared to a year ago. What's really significant here to me is that the cut in demand was reflected in a big reduction in coal and gas burned to generate electricity - which is of course what is supposed to happen as renewable energy generation increases. But it underlines the fact that cutting demand has a huge impact on the proportion of energy we supply from renewable sources.

Although renewable energy capacity had increased over the past year, the other thing that boosted generation was the exceptionally wet and windy weather the UK experienced this winter. Probably not enough of a 'silver lining' to make it worth it for the people who got flooded though... The effect of the weather is shown clearly in the breakdown of renewable energy generation below, with wind and hydro well up on a year ago.

Energy Trends 2014 renewable electricity breakdown
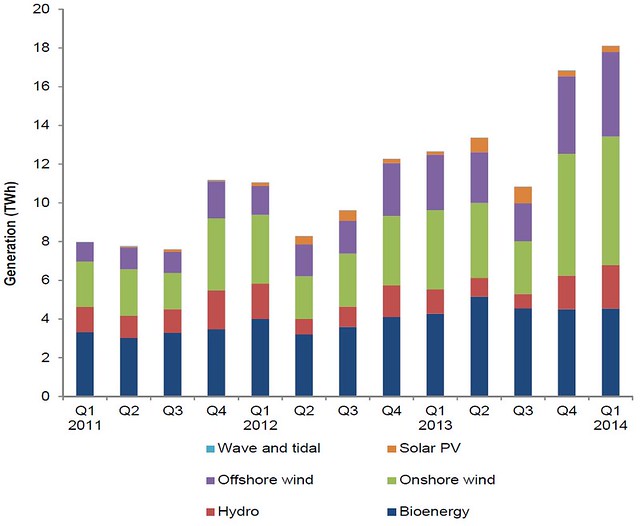
The seasonal trend of more solar power in the summer and more wind/hydro in the winter is clearly shown above as well, which makes a good case for increasing the amount of installed solar PV to even out renewable supply across the year. Though having said that, demand is higher in the winter anyway, so maybe it's not too big a deal.

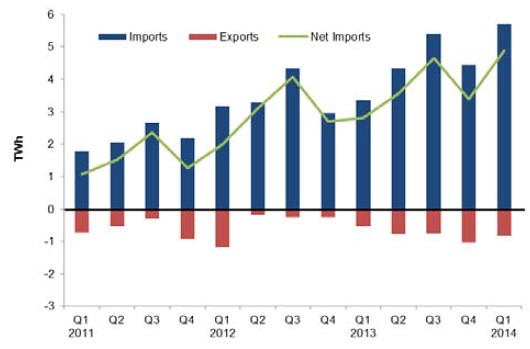
I'm afraid there's one not so good chart included for electricity though, and that's the one showing our net imports, which are steadily rising:

Energy Trends 2014 electricity net imports
Clearly this isn't a good thing for energy security, or for the UK balance of payments. Perhaps it's a sign of our steadily ageing generation infrastructure?

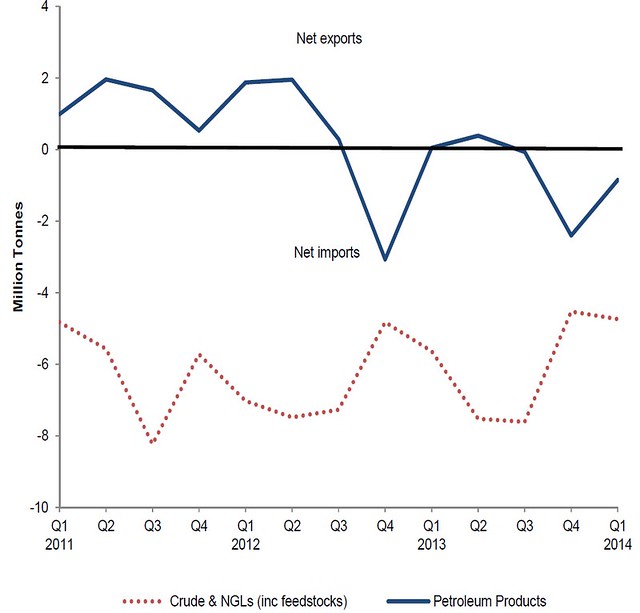
Moving on to fossil fuels, there's not a huge amount to report really:
  • Coal production was down 27.7% on a year ago.
  • Gas production was down 0.2%, but imports were down significantly due to the mild winter
  • Oil production was actually up 3.5% for a change!
Of course, we are still a major energy importer - the graph below shows net imports for crude oil (red) and also for petroleum products (blue). We've been a net importer of crude oil for a long time, and the recent rise in production is too small to make a dent in that. But our change to being a net importer of products (diesel, petrol, etc.) is relatively new, and due to reductions in refinery capacity in the UK.

Energy Trends 2014 oil net imports 

So, nice to have some good news to report on the renewables front, even if the overall picture hasn't changed a great deal.

Click here to read the rest of this post.

Saturday 14 June 2014

Catcher - 'major' new North Sea Oil field in context

Numerous news sources are busy celebrating the planned development of the new Catcher oil field in the North Sea. But few of them put it in context, with even the BBC describing it as "a major North Sea field", saying it could ultimately produce 100 million barrels of oil, and other sources mention a peak production of 50,000 barrels per day. These sound like big numbers, but let's compare to the real major oil field of the North Sea - Forties.

PlatformHolly.jpg

Forties is expected to produce over 4 billion barrels during its operational lifetime, and reached a peak output of  520,000 barrels per day in 1978. So that's forty times bigger than the Catcher field, and ten times the peak output. Catcher doesn't look so big now, does it?

Let's also compare it to our current oil production: 925,000 barrels per day, and our oil consumption of 1.5 million barrels per day. So it's basically going to produce 3.3% of our national consumption. Great, that'll make a huge difference... not.

Peak oil is still alive and well, and the IEA's recent report showed that over 80% of investment in energy oil and gas is just to make up for declining production from existing fields. So don't expect to see cheaper petrol or diesel any time soon. Or ever, in fact.


Image: "PlatformHolly" by employee of the U.S. government: public domain - http://www.netl.doe.gov/technologies/oil-gas/Petroleum/projects/EP/ResChar/15127Venoco.htm -- U.S. Department of Energy. Licensed under Public domain via Wikimedia Commons.

Click here to read the rest of this post.