We won't "run out", but we could well have shortages. Here's why...
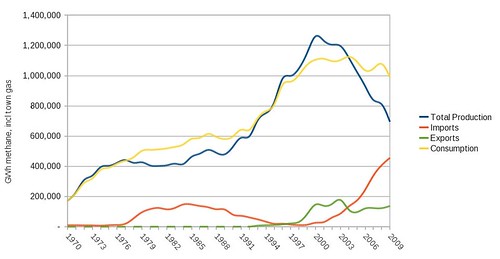
First, it's important to understand the overall picture. The UK had been a gas exporter from the mid-nineties until a few years ago, but now production from the North Sea has been plummeting for over five years, we're a significant importer. The graph below illustrates this - when the blue line is above the yellow, we were a net exporter, when it is below, we were a net importer. Click it for a larger version.
Gas supply in the UK comes from several sources at present:
- Production from the North Sea
- Imports from Norway via the Langeled pipeline
- The Interconnector, bringing gas from Zeebrugge in Belgium to Bacton in England. This can also export gas from the UK back to Belgium.
- The BBL pipeline, which brings gas from the Netherlands to Bacton in England.
- Liquefied Natural Gas (LNG) imports, through a range of terminals.
- Storage facilities in the UK, which are generally filled in the summer and drawn from in the winter.
- North Sea production is a secure supply, but meets less than half of peak winter gas demand in the UK. As with any supply, it is susceptible to accidents and malfunctions, such as this one in 2007.
- The Langeled pipeline can supply about 70 mcm (million cubic metres) a day at maximum rate, or about 15% of the UK peak demand during December 2010. Without this supply, the UK would not have enough gas, and its failure for a period in January 2010 caused the National Grid to issue several Gas Balancing Alerts and resulted in a surge in prices. At present, it is operating with no problems.
- The Interconnector and BBL pipeline are vital when we need extra gas, but to get it the UK has to pay a price determined by supply and demand in the rest of Europe. The BBL can supply up to 45 mcm/day, while the Interconnector can supply up to 58 mcm/day. When supply problems occur in Europe, as they have in the past due to disagreements between Russia and Ukraine, then the availability of gas imports is reduced. There is also the risk of malfunctions, such as the fire in 2008.
- LNG imports to the UK started quite recently, as the decline of North Sea production made them necessary. As with other imports, they are susceptible to malfunctions and also lack of supply if the market is short of gas. The peak supply during December 2010 has been a bit over 100 mcm/day.
- Finally, storage has been supplying about 10 to 15% of UK gas demand in December 2010. It can supply more, but only for a short period of time, as supplies will deplete quickly. Storage is split into long, medium and short range stores. The former are large in volume, while the latter are small and only for use during exceptionally high demand. There are two risks for storage. The first is technical faults, which have happened in Feb 2006 and Nov 2010. These are serious enough that even small glitches can push prices up, such as in early Dec 2010. The second risk is that the storage simply does not have enough gas in it - this is what will now be examined in more detail.
You can view the current amount of gas in storage, and various other bits of technical info, on a website run by the National Grid. Click the help link on that page for more info.
However, what's more interesting is to be able to look at the levels of gas storage this winter so far, and compare them to a year ago. It's quite a bit of work to get the data for this and make some charts, so I've done it for you. The following charts show long, medium and short range storage levels from October through to September, with the red line representing this winter, and the blue line winter 2009-10. Again, click for larger versions.
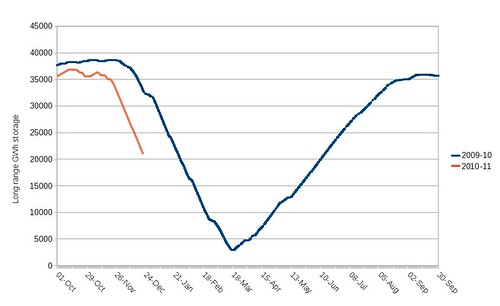
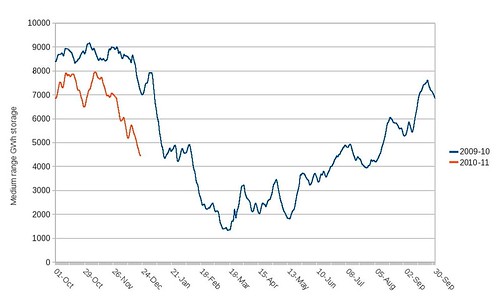
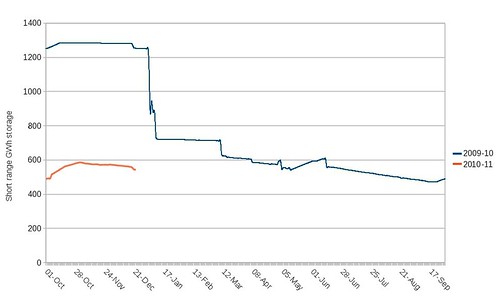
There are several things to note from these graphs:
- At the end of winter, around March 2010, gas storage was at a low level.
- All three classes of storage started off a a lower level in October 2010 than in October 2009, indicating that insufficient gas was injected over the summer to make up for the previous cold winter.
- In late December 2010, storage is well below the levels seen a year ago.
If withdrawals from storage continue at the average rate for December 2010 so far, there are only 45 days of stocks remaining.
So what will happen when stocks get low?
Supply to domestic customers will be guaranteed if at all possible, as the industry and government can not afford to have many thousands of people without heating in the winter, not to mention the technical difficulties with shutting off large areas of the gas network. The procedure that is followed is detailed on government and National Grid websites, such as this presentation.
The stages are:
- Gas Balancing Alert, to encourage extra supply and reduced demand through normal operation of the gas market. We've already had these on two days during December 2010, simply due to cold weather resulting in high gas demand.
- Stage 1 (potential emergency): Relax the specification on energy content of gas in the network, maximise use of gas under pressure within national pipelines (linepack), instruct customers on interruptible gas supply contracts to stop using gas. Public appeals to reduce gas use may be used.
- Stage 2 (Declaration of emergency): all suppliers are instructed to maximise supplies, and storage will maximise output until levels fall to a predetermined point. Normal gas market operations are suspended. Public appeals to reduce gas use may be used.
- Stage 3 (Firm load shedding): organisations (with some exceptions, e.g. hospitals) are instructed to reduce gas use. If voluntary reduction is not enough, gas supplies will be physically cut off, starting with the largest users. Public appeals to reduce gas use may be used.
- Stage 4 (System isolation): parts of the gas network will be isolated, resulting in no gas supply to any user in the affected areas.
- Stage 5: supplies are resumed when the emergency is over.
Electricity
One final point - about 40% of our electricity in the UK is generated by burning gas, and these power stations could have their supply cut in an emergency. While other sources, such as coal and oil fired stations would be brought to maximum output, there could still be a shortfall, so a gas supply emergency implies an electricity shortage as well.
Links
Here are links to where I got the data from for the charts above, and where you can read more:
- National Grid: Prevailing View, with current status of the gas system.
- National Grid: Data Item Explorer, for historical data on all elements of the gas supply system.
- National Grid: Entry Zone Graphs, with live views of the past 10 minutes, 60 minutes or 24 hours of gas supply.
- National Grid: Real-time electricity data.
- DECC: Government energy statistics on gas.
I'll probably do an update in a few weeks, when the effect of the weather has become clearer. In the meantime, consider what you might do in a gas supply emergency, and make appropriate preparations.
Mike
Just a quick note to say this is being actively discussed on the PowerSwitch forum, on this thread (skip to the latter pages, as it started in Jan 2010): http://www.powerswitch.org.uk/forum/viewtopic.php?t=13150
ReplyDeleteI was reading another post http://energy.legendpower.com/2010/03/01/global-oil-countdown/
ReplyDeletethat has a count-down clock claiming that supply will be almost completely dissapated in 38 years and counting.. is this true??
Actually, it's not about oil running out, but about the supply falling. There'll still be some oil in 200 years, just not much.
ReplyDeleteOnce past the peak, oil supply could fall at anywhere between 4 and 8% a year. That means it will have fallen by half in 9-18 years after the peak, and hill continue to halve at that rate. Of course, that assumes that other factors don't reduce it faster, e.g. war, natural disasters, etc....