The latest instalment of DECC's Energy Trends series has just been published, covering Q1 2011. You can download a copy here (1.8MB PDF).
The summary page says it all really, with these bullet points:
- Total energy production was 11 per cent lower than in the first quarter of 2010.
- Oil production was 15½ per cent lower than in the first quarter of 2010, due to maintenance activity and slowdowns.
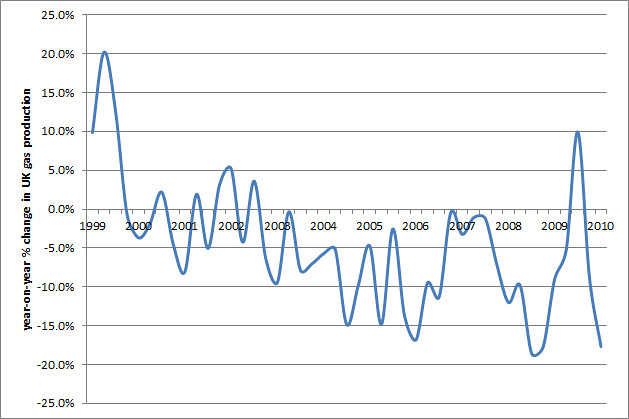
- Natural gas production was 17½ per cent lower compared with the first quarter of 2010. Net imports of gas increased by ½ per cent. Liquefied Natural Gas (LNG) accounted for 43½ per cent of gas imports.
Here's a chart of quarterly oil production in the UK, from the start of 1999 to Q1 2011:
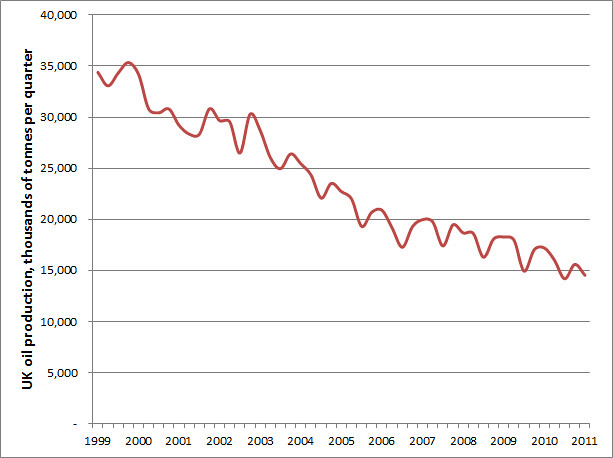
Not looking too promising, is it? To help see the trend, here's a graph showing the % change year-on-year from 2000 to 2011:
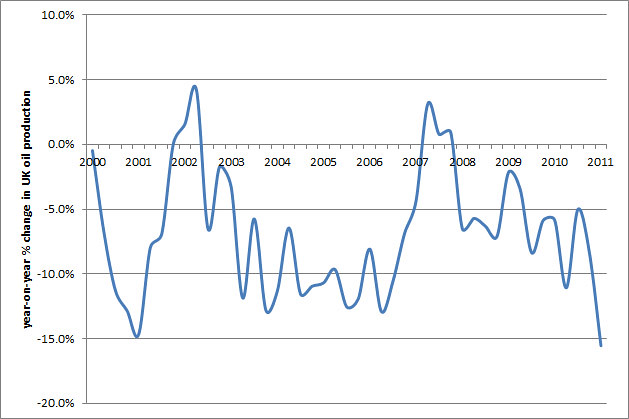
As you can see, there's been the odd blip where production has risen, but the last time was in 2007, and the first quarter for this year set a new record for the decline.
Moving on to gas, here's the another production graph, but this time I've added on the amount being imported as well:
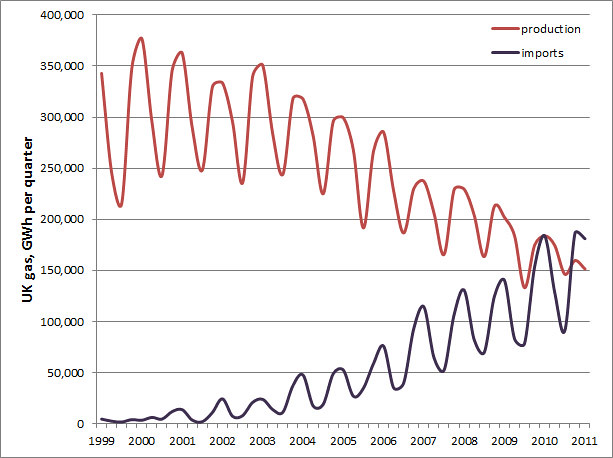
As you can see, there's a similar trend as for oil, though with greater seasonal fluctuations. I think this is probably because the gas market is more fluid, with pipelines connecting us to Europe, meaning production is often slowed down while prices are low. Here's a percentage change graph again, with the same high fluctuations, and close to a new record on decline:
Just to reiterate the problem we have with gas, here's another graph showing the percentage of UK gas supplied by imports, on a quarterly basis:
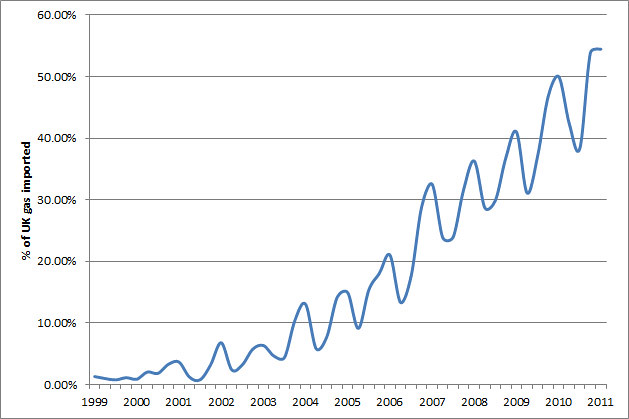
As you can see, we imported more than half our gas in the final quarter of 2010, which isn't surprising as it was very cold, but also in the first quarter of 2011 - when it was actually relatively mild!
Many thanks to DECC for providing these figures publicly - shame the government isn't taking the urgent action which the graphs above should prompt them to. It's not just about energy security and keeping the lights on this winter, it's also about whether we can afford the imports. To put it in context, wholesale gas has been trading on the National Grid at about 2p/kWh this summer. The graphs above are in GWh, one of which would cost £20,000 at the same rates.
In the past two quarters we've imported over 367,000 GWh - that's about £7.3 billion worth of gas. So if anyone was still wondering why gas prices are going up, now you have part of the answer...
It's summer now, but winter is coming - take the time over the coming months to insulate your walls and loft if you've not already done so, and if you want to do even more, take a look at my other blog for some ideas.
Hi Mike,(and Tracy)
ReplyDeleteI've been digging around on the DECC site too, doing my OU Sustainable Energy course. Did you see this one...
http://www.decc.gov.uk/assets/decc/Statistics/publications/dukes/324-dukes-2010-longterm.pdf
And their energy flow chart series -
http://www.decc.gov.uk/en/content/cms/statistics/publications/flow/flow.aspx
is another fascinating collection. For 2009, our conversion losses (49.7 mtoe) are ten times the renewable generation (4.9 mtoe)...
cheers!
Mean Mr Mustard
(ex PowerSwitch)
Yeah, there's a mine of interesting info there!
ReplyDeleteMike