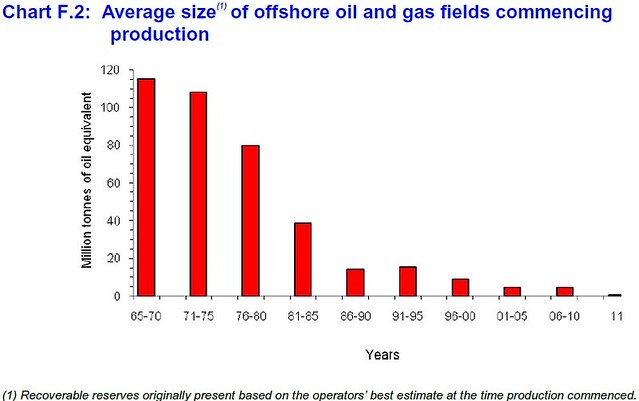
I just came across this graph on page 110 of the 2012 Digest of UK Energy Statistics (internet content) from DECC, showing the size of new UK oil and gas fields coming into production in the UK over the past 55 years. Speaks for itself really...
Page 2 of the Long Term Trends section of DUKES has this cheery paragraph too:
Trends in the production of primary fuels in the United Kingdom are illustrated in Chart 1.1.2. In 2011, total energy production was 137 million tonnes of oil equivalent, an increase of 24 per cent on production in 1970, but down by a record 13.2 per cent on 2010. Total energy production has fallen in each of the last 12 years since it peaked in 1999. In the last ten years, UK energy production has declined at a rate of 6.8 per cent per year; within this natural gas production has declined at the fastest rate, down 8.1 per cent per year, followed by petroleum down 7.8 per cent, coal down 5.3 per cent with primary electricity down 1.9 per cent per year. Bioenergy and waste has grown by an average 8.5 per cent per year over this same time period, though in 2011 accounted for only 4.2 per cent of the UK’s energy production.
Can't help thinking that the growing energy import bill must be having a growing impact on the economy, but it doesn't seem to make the headlines very often...

No comments:
Post a Comment